Sentiment & AI
Machine-Readable Market Data: From Candlesticks to Market State
Oyamori
Every candlestick you read is machine-readable market data waiting to happen. Three hundred years ago a Japanese rice merchant built the first language for understanding markets. Today Oyamori translates that same knowledge into something a machine can execute. This article is the story of that translation — from candlesticks to market state — and why it changes what a trading signal can be.
A Gift from 18th Century Japan
Long before computers. Long before algorithms. Long before artificial intelligence. There was a trader in Japan trying to solve a timeless problem: how do we understand a market?
In the 1700s, rice was one of the most important commodities in Japan. Prices moved daily, and merchants searched constantly for an edge. Among them was a legendary rice merchant from Sakata named Munehisa Homma.
Homma was not a programmer, a quant, or a data scientist. Yet his contribution would shape trading for centuries. Rather than watching price alone, he observed something deeper: markets were driven not only by supply and demand, but by human emotion — fear, greed, hope, panic, confidence, doubt. Price alone could not tell the whole story.
From that pursuit emerged one of the most influential innovations in financial history: the candlestick chart.

The Birth of a Visual Language
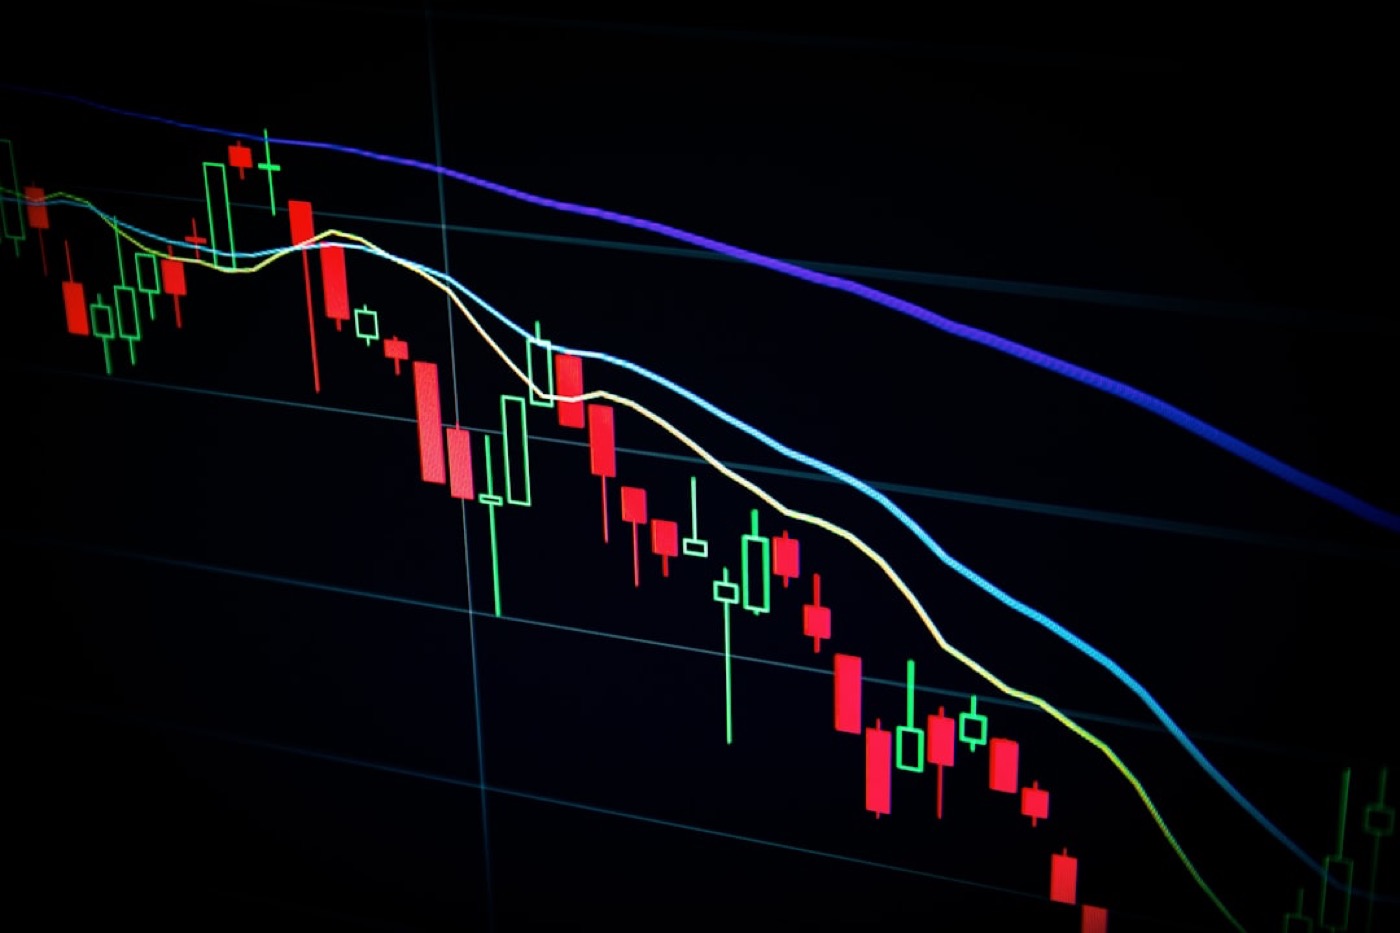
At first glance a candlestick looks simple: a body, a wick, a color. Yet every candle holds a compressed story. It tells you where the market opened, where it closed, how high it traveled, and how low it fell — and, more importantly, what happened between buyers and sellers along the way.
A long bullish candle may represent conviction. A rejection wick may mark resistance. A small, indecisive body may reveal uncertainty. For the first time, traders had a visual language for market behavior — not just numbers, but behavior. The candlestick chart became one of the earliest and most successful forms of market intelligence. If you are still learning to interpret these shapes, start with how to read stock charts.
The World's Largest Trading Knowledge Base
The real breakthrough was not the candlestick itself — it was what happened next. Over two centuries, millions of traders studied candlesticks. They observed, tested, documented, debated, and refined. Generation after generation added discoveries. Patterns earned names: Hammer, Doji, Engulfing, Morning Star, Bull Flag, Failed Breakout, Opening Range Breakout.
The result was remarkable — one of humanity's largest crowdsourced trading experiments. A candlestick pattern is not merely a shape. It is compressed human experience. When a trader spots a Hammer, they are not reacting to geometry; they are referencing thousands of historical observations, journals, books, mentors, communities, and real financial risk. Every pattern carries knowledge. Every pattern carries history.
The Limitation of Human Interpretation
Despite centuries of progress, one challenge remained: consistency. A trader may read a setup perfectly one day and miss the identical setup the next. Emotion, fatigue, stress, and bias interfere. Two traders can look at the same chart and reach opposite conclusions — and so can the same trader on different days.
The problem was never a lack of knowledge. The problem was operationalizing it. Candlesticks were never the destination; they were the interface. Their job was to help humans process market information efficiently. In modern terms, candlesticks are human-readable market data.
But what if a system could process the underlying information directly? What if centuries of trading knowledge could be translated into a form a machine understands and executes?
From Human-Readable to Machine-Readable Market Data
Machine-readable market data is the structured, measurable representation of everything a chart shows a human — converted into numbers a system can score, compare, and act on. Oyamori does not reject candlesticks. It stands on them. The goal is not to replace human discovery but to encode it.
A human sees a shape. Oyamori sees the measurements underneath that shape.
| A human sees | Oyamori measures | |
|---|---|---|
| Breakout | a decisive candle through a level | RVOL + range expansion + momentum shift |
| Hammer | a long lower wick rejecting the lows | wick ratio + body ratio + close strength + location |
| Failed Breakout | a break that snaps back | rejection probability + volume failure + reversal risk |
| Read as | intuition, experience, "feel" | a scored, comparable market state |
The visual pattern becomes structured intelligence. The chart becomes data. The interpretation becomes logic. The knowledge becomes executable. Try it below — pick a pattern and watch the human read turn into machine measurements:
The Oyamori Pipeline
Instead of asking "what does this chart look like?", Oyamori asks "what state is the market in right now?" That shift matters, because market states can be measured, scored, compared, and fed into a decision system. The transformation runs as a pipeline:
Market State Intelligence
This philosophy reaches past candlesticks. Oyamori combines multiple layers of information into a single machine-readable representation of the market — one designed not for visual interpretation, but for intelligent decision-making.
Together these inputs form what we call market state intelligence. It is the same goal Homma had — understand the market — pursued with the full instrument panel he never had. And because the state is explicit and measurable, it can be inspected rather than trusted blindly, which is exactly the line between a black-box AI signal and a transparent one.
The Next Chapter
More than two hundred years ago, Japanese rice merchants gave the world a tool that helped humans understand markets. Today, markets generate more information than any human can read. The challenge is no longer obtaining data — it is transforming knowledge into intelligence.
Oyamori is one next chapter in that journey. Not by replacing the innovations of the past, but by building on them, respecting them, and translating them into a language modern systems can act on. Because every candlestick carries a story, every pattern carries knowledge, and every discovery deserves to live on — not only in the minds of traders, but inside systems that can learn from centuries of human innovation.